01Public preview
Management reporting
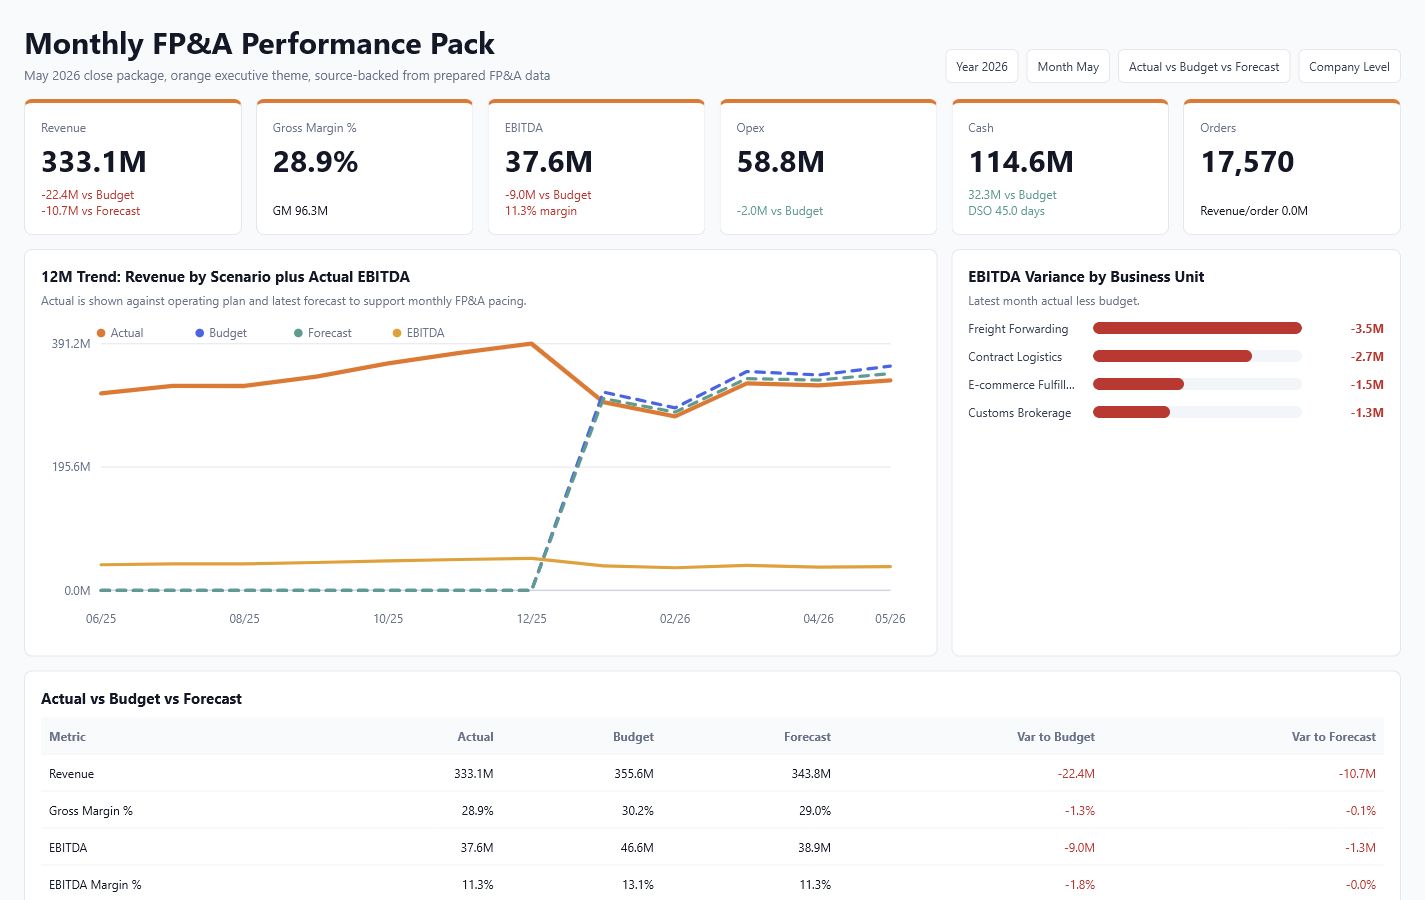
Monthly FP&A Performance Pack
Executive close pack tying Actual/Budget/Forecast to EBITDA bridge, cash visibility, drilldowns, and action commentary.
53 DAX measures13-table modelvariance bridge
Power BI decision previews
This hub organizes the Power BI portfolio by the business question each preview answers. It keeps the recruiter path clear: finance judgment first, model depth second, and public-safe interactive proof patterns throughout.
Start here
They show management reporting, forecasting, regional close control, cash discipline, and margin recovery.
Project chart lens
Scan each preview by finance question, metric at risk, and owner action readiness.
Decision lens 01
These are the strongest projects for FP&A, regional finance, treasury, and commercial finance roles. They connect reporting to forecast calls, cash control, margin action, and governance confidence.
Management reporting
Executive close pack tying Actual/Budget/Forecast to EBITDA bridge, cash visibility, drilldowns, and action commentary.
Board reporting
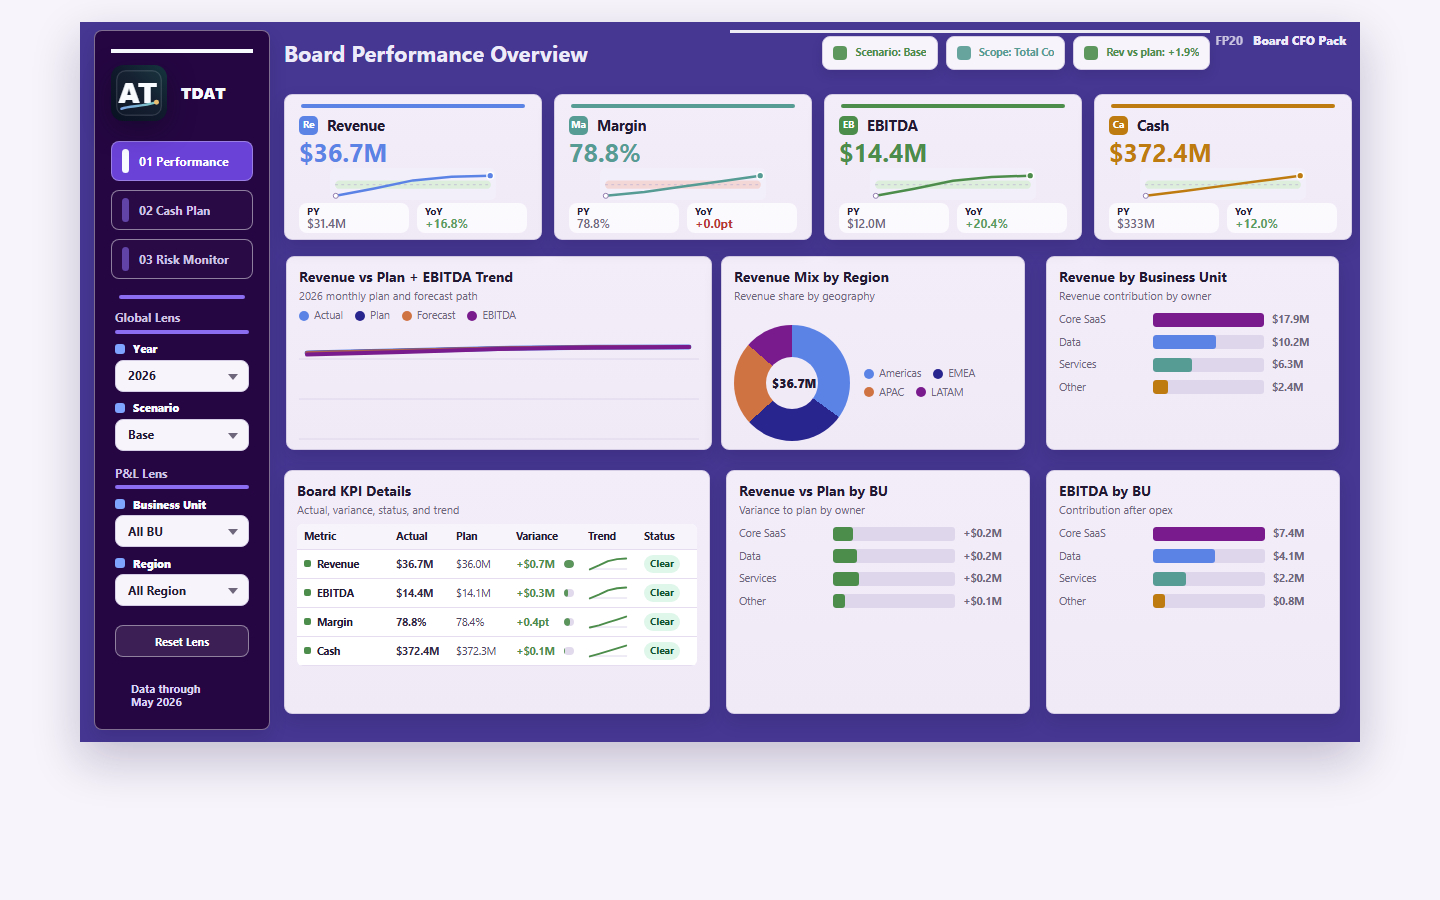
Board pack summarizing performance, cash runway, covenant headroom, valuation sensitivity, and owner actions.
Planning model
Scenario model translating volume, cost, headcount, and cash assumptions into forecast decisions.
Regional MNC finance
Regional consolidation view for country/entity variance, FX translation, eliminations, and close exceptions.
Treasury and cash
Treasury view prioritizing cash roll-forward, overdue AR, DSO, runway, FX exposure, and collection actions.
CFO metrics
CFO metrics pack for ARR, NRR/GRR, churn, CAC payback, cohort economics, and forecast health.
Cost FP&A
Cost FP&A pack decomposing standard cost variance, yield, capacity, inventory days, and margin recovery actions.
Commercial finance
Lane-level profitability view showing customers, services, and lanes needing repricing or renegotiation.
Finance governance
Governance BI monitoring reconciliation breaks, data quality risk, refresh reliability, and owner action queues.
Decision lens 02
These products show the commercial BI range behind revenue growth, conversion, retention, seller quality, and campaign efficiency.
Ecommerce executive KPIs
Executive ecommerce review for revenue, margin, customers, orders, refunds, and operating levers.
Conversion analytics
Conversion funnel dashboard tracing acquisition-to-order leakage by segment, category, and channel.
Customer lifecycle
Cohort and LTV dashboard exposing retention decay, churn signals, customer value, and win-back priorities.
Marketing finance
Campaign ROI review showing which channels to scale, pause, or fix based on spend efficiency.
Marketplace operations
Seller performance dashboard ranking GMV, fulfillment, cancellation, rating, stock risk, and growth actions.
Decision lens 03
This group demonstrates unit economics, growth quality, risk monitoring, provision pressure, and client retention thinking across financial services use cases.
Payments profitability
Payments profitability dashboard linking merchant mix, transaction drivers, margin scenarios, and fee economics.
Credit risk
Credit-risk provision dashboard for loan book trend, delinquency, collections SLA, and provision pressure.
Risk operations
Fraud monitoring view surfacing suspicious patterns, case backlog, rule performance, and AML actions.
Neobank growth
Growth and retention pack tying onboarding funnel, cohorts, churn, marketing ROI, and LTV to profitable growth.
Wealth analytics
AUM retention dashboard combining portfolio mix, client risk, suitability, and retention actions.
Decision lens 04
This final lens extends the portfolio into finance-owned sustainability decisions: emissions, supplier intensity, carbon cost, abatement ROI, and risk governance.
ESG finance
CFO-style ESG finance dashboard with four large KPI cards, header Current Lens, dynamic TableEx cards, carbon cost scenarios, and abatement ROI governance.
Public-safe policy: this hub publishes curated descriptions and interactive sanitized previews. Raw extracts, prepared CSVs, PBIX/PBIT files, local paths, user settings, security bindings, and private QA/build artifacts remain outside the GitHub Pages surface.