What changed versus budget and forecast, why did it move, who owns the recovery action, and what cash risk needs attention?
Power BI management reporting
Monthly FP&A Performance Pack
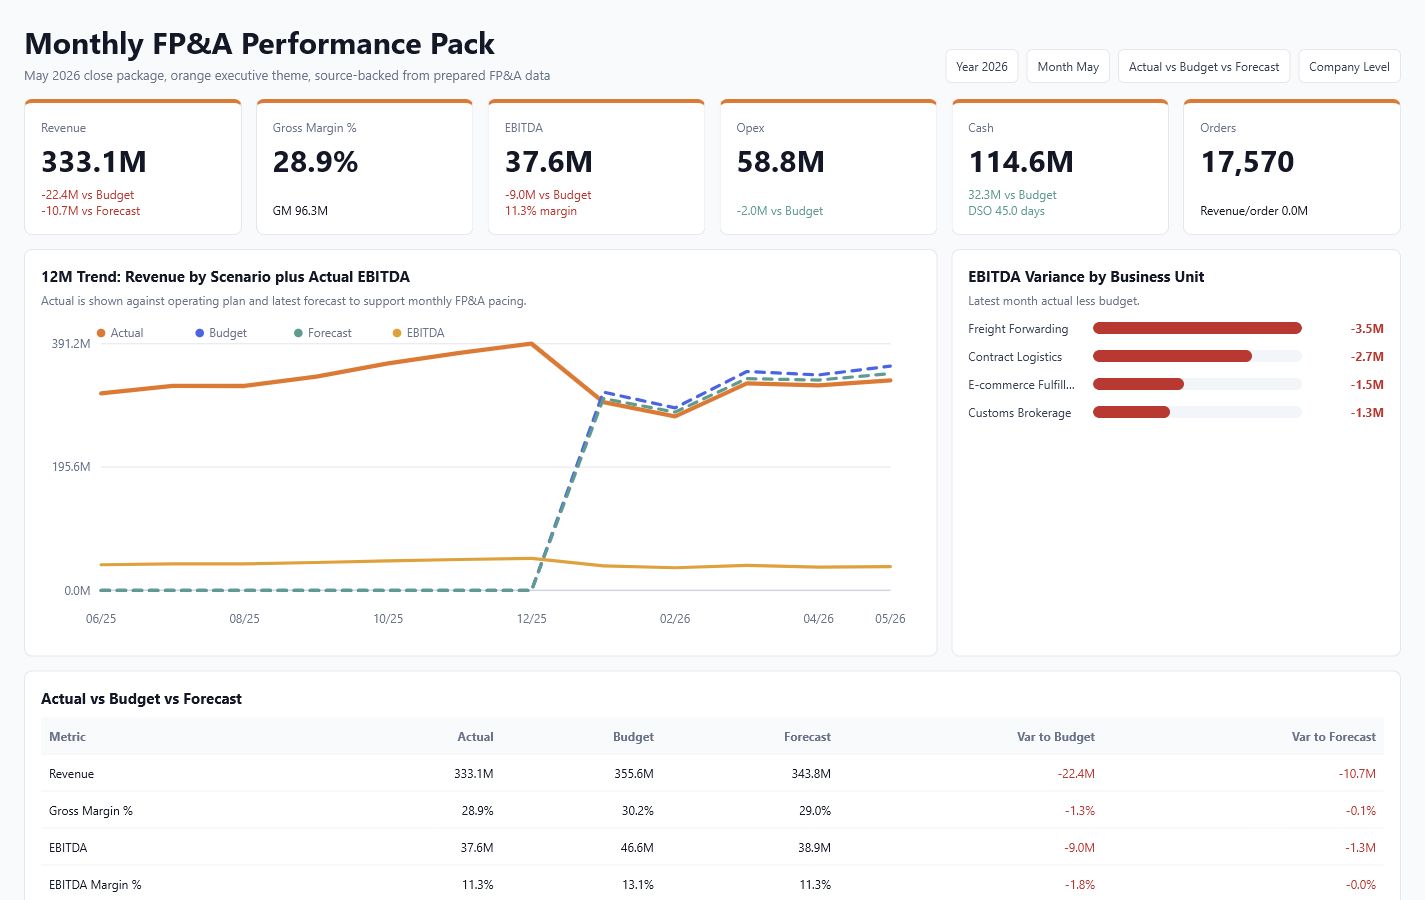
Executive close pack for management and business-unit review, covering Actual vs Budget vs Forecast, Revenue, Gross Margin, EBITDA, Opex, Cash, variance bridge, and drilldowns by BU, product, customer, department, and region.
Interactive preview
Open full screen13-table model supporting Actual/Budget/Forecast variance, EBITDA bridge, cash view, and BU/customer drilldowns.
Revenue, gross margin %, EBITDA, and cash reconcile through PBIX validation, relationship checks, and DAX spot checks before handoff.
This portfolio preview uses synthetic or anonymized data to demonstrate FP&A reporting logic without exposing company-confidential information.